Global Natural Ferulic Acid (CAS 1135-24-6) Market – Strategic Industry Analysis (2026–2036)
Market Overview
The Global Natural Ferulic Acid (CAS 1135-24-6) Market was valued at USD XXX million in 2025 and is projected to reach USD XXX million by 2036, expanding at a CAGR of XX% during the forecast period.
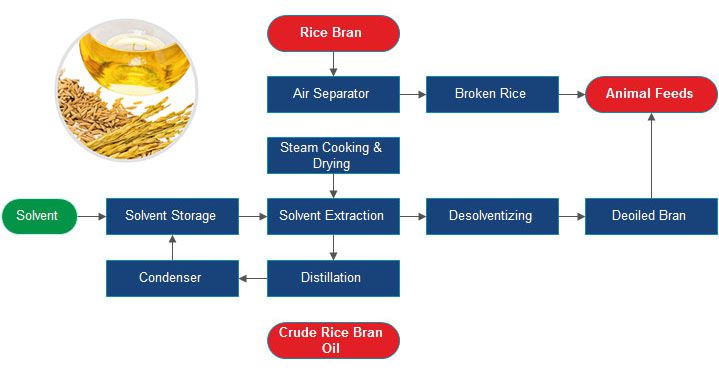
Natural Ferulic Acid is a plant-derived phenolic compound extracted primarily from rice bran, wheat bran, oats, and other cereal sources. It is widely recognized for its antioxidant, anti-inflammatory, and UV-protective properties. Due to these characteristics, it is extensively used in cosmetics, nutraceuticals, functional foods, and pharmaceutical intermediates.
Market growth is supported by increasing demand for natural antioxidants, expansion of clean-label food ingredients, and rising adoption of plant-based actives in premium skincare formulations.
Product Overview

Natural Ferulic Acid offers:
-
Strong free radical scavenging activity
-
UV absorption enhancement in cosmetic formulations
-
Stability improvement when combined with vitamins C & E
-
Applications in functional food fortification
It is available in crystalline powder form and incorporated into serums, dietary supplements, and pharmaceutical preparations.
Market Segmentation Analysis
By Quality Grade
-
Ordinary Quality (Food & Industrial Grade)
-
Standard purity levels
-
Used in food fortification and general applications
-
-
High Quality (Cosmetic & Pharmaceutical Grade)
-
≥99% purity
-
Low heavy metal and impurity levels
-
Premium skincare and drug intermediate applications
-
High-quality grade commands higher margins due to strict compliance standards.
By Source
-
Rice Bran Extracted
-
Wheat Bran Extracted
-
Corn Bran Extracted
-
Synthetic-Derived (for comparison in industry benchmarking)
Rice bran remains the dominant commercial source.
By Application
-
Food & Beverages
-
Functional foods
-
Dietary supplements
-
Antioxidant fortification
-
-
Cosmetics
-
Anti-aging serums
-
Sunscreen formulations
-
Skin-brightening products
-
-
Pharmaceutical Intermediates
-
Cardiovascular and anti-inflammatory drug research
-
-
Nutraceuticals
-
Animal Feed Additives
Cosmetics represent the fastest-growing application segment globally.
By End-Use Industry
-
Personal Care & Beauty
-
Food & Beverage Manufacturing
-
Pharmaceutical Manufacturing
-
Nutraceutical Companies
Regional Analysis
North America
-
Strong demand for clean-label supplements.
-
Advanced cosmetic innovation ecosystem.
-
Growing nutraceutical consumption.
Europe
-
Strict ingredient safety regulations.
-
Increasing demand for plant-based antioxidants.
-
Germany and France as key cosmetic production hubs.
Asia-Pacific
-
Largest production base due to rice bran availability.
-
China and Japan leading in cosmetic and pharmaceutical applications.
-
Expanding nutraceutical markets in India and Southeast Asia.
South America
-
Growing functional food demand.
-
Expanding agricultural feedstock availability.
Middle East & Africa
-
Rising beauty and personal care consumption.
-
Limited local production; reliance on imports.
Competitive Landscape
Major Market Participants
-
Delekang
-
App Chem
-
Hubei Yuancheng
-
Okayasu Shoten
-
TSUNO
-
HSF Biotech
-
Oryza Oil & Fat Chemical
-
Shaanxi Guanjie
-
Ankang Pharmaceutical
-
Huacheng Biotech
Additional Key Players
-
Zhejiang Delekang Food
-
Xi’an Natural Field Bio-Technique
-
Kangcare Bioindustry
-
Chenguang Biotech
-
Naturex (now part of Givaudan)
-
Sabinsa Corporation
-
Indena S.p.A.
-
Synthite Industries
-
ADM (Plant Extract Division)
-
Cargill Bioindustrial
Competition is driven by extraction efficiency, purity levels, certification (organic/non-GMO), and global distribution capabilities.
Impact of COVID-19
-
Increased consumer focus on immunity-boosting supplements.
-
Temporary disruption in raw material logistics.
-
Surge in skincare product demand during lockdown periods.
-
Strengthened nutraceutical sector supported recovery.
Market Drivers
-
Rising demand for natural antioxidants.
-
Expansion of anti-aging skincare products.
-
Growth of functional food and nutraceutical markets.
-
Increasing awareness of oxidative stress prevention.
-
Shift toward plant-based cosmetic ingredients.
Market Challenges
-
Variability in agricultural raw material supply.
-
Extraction cost fluctuations.
-
Regulatory compliance for food and cosmetic use.
-
Competition from synthetic antioxidants.
-
Stability challenges in formulation systems.
Emerging Trends
-
Microencapsulation for enhanced stability.
-
Combination formulations with vitamins C and E.
-
Growth in organic-certified ferulic acid.
-
Expansion of botanical extract blends.
-
Increasing use in sunscreen synergy systems.
-
Sustainable rice bran extraction technologies.
Porter’s Five Forces Analysis
1. Threat of New Entrants – Moderate
Extraction technology knowledge required, but agricultural feedstock is widely available.
2. Bargaining Power of Suppliers – Moderate to High
Dependence on rice and wheat bran supply.
3. Bargaining Power of Buyers – High
Large cosmetic and nutraceutical companies negotiate pricing.
4. Threat of Substitutes – Moderate
Alternative antioxidants such as vitamin C, resveratrol, and tocopherols.
5. Competitive Rivalry – High
Numerous regional botanical extract suppliers compete globally.
SWOT Analysis
Strengths
-
Strong antioxidant efficacy.
-
Broad application across industries.
-
Plant-based and consumer-friendly perception.
Weaknesses
-
Sensitivity to light and oxidation.
-
Agricultural dependency.
Opportunities
-
Premium skincare product growth.
-
Expansion of dietary supplement markets.
-
Clean-label food ingredient adoption.
-
Organic certification demand.
Threats
-
Synthetic antioxidant cost advantages.
-
Regulatory changes in cosmetic ingredients.
-
Climate-related agricultural disruptions.
Value Chain Analysis
-
Raw Material Procurement
-
Rice bran
-
Wheat bran
-
-
Extraction & Hydrolysis
-
Solvent extraction
-
Enzymatic hydrolysis
-
-
Purification & Crystallization
-
Filtration
-
Quality testing
-
-
Packaging & Distribution
-
Bulk powder packaging
-
Cosmetic-grade supply chains
-
-
End-Use Integration
-
Serum formulation
-
Supplement manufacturing
-
-
Retail & Consumer Use
-
Skincare products
-
Nutritional supplements
-
Trend Outlook (2026–2036)
-
Asia-Pacific to maintain production dominance.
-
Cosmetic segment expected to outpace food applications.
-
High-purity pharmaceutical grade to gain share.
-
Sustainability and traceability certifications to become competitive differentiators.
-
Expansion of antioxidant blend formulations.
Strategic Recommendations
For Manufacturers
-
Invest in stabilized and encapsulated formulations.
-
Secure long-term agricultural sourcing contracts.
-
Expand high-purity production lines.
For Investors
-
Target botanical extract companies aligned with clean beauty trends.
-
Focus on vertically integrated producers.
For Distributors
-
Strengthen supply to cosmetic manufacturers.
-
Provide technical formulation support.
For Policymakers
-
Encourage sustainable agricultural by-product utilization.
-
Support botanical extraction R&D initiatives.
Conclusion
The Natural Ferulic Acid Market is poised for steady growth driven by expanding demand for plant-based antioxidants in cosmetics, food, and pharmaceuticals. As clean-label and anti-aging trends intensify, high-quality and sustainably sourced ferulic acid will play a central role in market expansion through 2036. Companies prioritizing purity, innovation, and sustainable sourcing will secure long-term competitive advantage.
1. Market Overview of Natural Ferulic Acid (CAS 1135-24-6)
1.1 Natural Ferulic Acid (CAS 1135-24-6) Market Overview
1.1.1 Natural Ferulic Acid (CAS 1135-24-6) Product Scope
1.1.2 Market Status and Outlook
1.2 Natural Ferulic Acid (CAS 1135-24-6) Market Size by Regions:
1.3 Natural Ferulic Acid (CAS 1135-24-6) Historic Market Size by Regions
1.4 Natural Ferulic Acid (CAS 1135-24-6) Forecasted Market Size by Regions
1.5 Covid-19 Impact on Key Regions, Keyword Market Size YoY Growth
1.5.1 North America
1.5.2 East Asia
1.5.3 Europe
1.5.4 South Asia
1.5.5 Southeast Asia
1.5.6 Middle East
1.5.7 Africa
1.5.8 Oceania
1.5.9 South America
1.5.10 Rest of the World
1.6 Coronavirus Disease 2019 (Covid-19) Impact Will Have a Severe Impact on Global Growth
1.6.1 Covid-19 Impact: Global GDP Growth, 2019, 2020 and 2021 Projections
1.6.2 Covid-19 Impact: Commodity Prices Indices
1.6.3 Covid-19 Impact: Global Major Government Policy
2. Covid-19 Impact Natural Ferulic Acid (CAS 1135-24-6) Sales Market by Type
2.1 Global Natural Ferulic Acid (CAS 1135-24-6) Historic Market Size by Type
2.2 Global Natural Ferulic Acid (CAS 1135-24-6) Forecasted Market Size by Type
2.3 Ordinary Quality
2.4 High Quality
3. Covid-19 Impact Natural Ferulic Acid (CAS 1135-24-6) Sales Market by Application
3.1 Global Natural Ferulic Acid (CAS 1135-24-6) Historic Market Size by Application
3.2 Global Natural Ferulic Acid (CAS 1135-24-6) Forecasted Market Size by Application
3.3 Food
3.4 Cosmetic
3.5 Pharmaceutical Intermediates
3.6 Others
4. Covid-19 Impact Market Competition by Manufacturers
4.1 Global Natural Ferulic Acid (CAS 1135-24-6) Production Capacity Market Share by Manufacturers
4.2 Global Natural Ferulic Acid (CAS 1135-24-6) Revenue Market Share by Manufacturers
4.3 Global Natural Ferulic Acid (CAS 1135-24-6) Average Price by Manufacturers
5. Company Profiles and Key Figures in Natural Ferulic Acid (CAS 1135-24-6) Business
5.1 Delekang
5.1.1 Delekang Company Profile
5.1.2 Delekang Natural Ferulic Acid (CAS 1135-24-6) Product Specification
5.1.3 Delekang Natural Ferulic Acid (CAS 1135-24-6) Production Capacity, Revenue, Price and Gross Margin
5.2 App Chem
5.2.1 App Chem Company Profile
5.2.2 App Chem Natural Ferulic Acid (CAS 1135-24-6) Product Specification
5.2.3 App Chem Natural Ferulic Acid (CAS 1135-24-6) Production Capacity, Revenue, Price and Gross Margin
5.3 Hubei Yuancheng
5.3.1 Hubei Yuancheng Company Profile
5.3.2 Hubei Yuancheng Natural Ferulic Acid (CAS 1135-24-6) Product Specification
5.3.3 Hubei Yuancheng Natural Ferulic Acid (CAS 1135-24-6) Production Capacity, Revenue, Price and Gross Margin
5.4 Okayasu Shoten
5.4.1 Okayasu Shoten Company Profile
5.4.2 Okayasu Shoten Natural Ferulic Acid (CAS 1135-24-6) Product Specification
5.4.3 Okayasu Shoten Natural Ferulic Acid (CAS 1135-24-6) Production Capacity, Revenue, Price and Gross Margin
5.5 TSUNO
5.5.1 TSUNO Company Profile
5.5.2 TSUNO Natural Ferulic Acid (CAS 1135-24-6) Product Specification
5.5.3 TSUNO Natural Ferulic Acid (CAS 1135-24-6) Production Capacity, Revenue, Price and Gross Margin
5.6 HSF
5.6.1 HSF Company Profile
5.6.2 HSF Natural Ferulic Acid (CAS 1135-24-6) Product Specification
5.6.3 HSF Natural Ferulic Acid (CAS 1135-24-6) Production Capacity, Revenue, Price and Gross Margin
5.7 Oryza
5.7.1 Oryza Company Profile
5.7.2 Oryza Natural Ferulic Acid (CAS 1135-24-6) Product Specification
5.7.3 Oryza Natural Ferulic Acid (CAS 1135-24-6) Production Capacity, Revenue, Price and Gross Margin
5.8 Shaanxi Guanjie
5.8.1 Shaanxi Guanjie Company Profile
5.8.2 Shaanxi Guanjie Natural Ferulic Acid (CAS 1135-24-6) Product Specification
5.8.3 Shaanxi Guanjie Natural Ferulic Acid (CAS 1135-24-6) Production Capacity, Revenue, Price and Gross Margin
5.9 Ankang
5.9.1 Ankang Company Profile
5.9.2 Ankang Natural Ferulic Acid (CAS 1135-24-6) Product Specification
5.9.3 Ankang Natural Ferulic Acid (CAS 1135-24-6) Production Capacity, Revenue, Price and Gross Margin
5.10 Huacheng
5.10.1 Huacheng Company Profile
5.10.2 Huacheng Natural Ferulic Acid (CAS 1135-24-6) Product Specification
5.10.3 Huacheng Natural Ferulic Acid (CAS 1135-24-6) Production Capacity, Revenue, Price and Gross Margin
6. North America
6.1 North America Natural Ferulic Acid (CAS 1135-24-6) Market Size
6.2 North America Natural Ferulic Acid (CAS 1135-24-6) Key Players in North America
6.3 North America Natural Ferulic Acid (CAS 1135-24-6) Market Size by Type
6.4 North America Natural Ferulic Acid (CAS 1135-24-6) Market Size by Application
7. East Asia
7.1 East Asia Natural Ferulic Acid (CAS 1135-24-6) Market Size
7.2 East Asia Natural Ferulic Acid (CAS 1135-24-6) Key Players in North America
7.3 East Asia Natural Ferulic Acid (CAS 1135-24-6) Market Size by Type
7.4 East Asia Natural Ferulic Acid (CAS 1135-24-6) Market Size by Application
8. Europe
8.1 Europe Natural Ferulic Acid (CAS 1135-24-6) Market Size
8.2 Europe Natural Ferulic Acid (CAS 1135-24-6) Key Players in North America
8.3 Europe Natural Ferulic Acid (CAS 1135-24-6) Market Size by Type
8.4 Europe Natural Ferulic Acid (CAS 1135-24-6) Market Size by Application
9. South Asia
9.1 South Asia Natural Ferulic Acid (CAS 1135-24-6) Market Size
9.2 South Asia Natural Ferulic Acid (CAS 1135-24-6) Key Players in North America
9.3 South Asia Natural Ferulic Acid (CAS 1135-24-6) Market Size by Type
9.4 South Asia Natural Ferulic Acid (CAS 1135-24-6) Market Size by Application
10. Southeast Asia
10.1 Southeast Asia Natural Ferulic Acid (CAS 1135-24-6) Market Size
10.2 Southeast Asia Natural Ferulic Acid (CAS 1135-24-6) Key Players in North America
10.3 Southeast Asia Natural Ferulic Acid (CAS 1135-24-6) Market Size by Type
10.4 Southeast Asia Natural Ferulic Acid (CAS 1135-24-6) Market Size by Application
11. Middle East
11.1 Middle East Natural Ferulic Acid (CAS 1135-24-6) Market Size
11.2 Middle East Natural Ferulic Acid (CAS 1135-24-6) Key Players in North America
11.3 Middle East Natural Ferulic Acid (CAS 1135-24-6) Market Size by Type
11.4 Middle East Natural Ferulic Acid (CAS 1135-24-6) Market Size by Application
12. Africa
12.1 Africa Natural Ferulic Acid (CAS 1135-24-6) Market Size
12.2 Africa Natural Ferulic Acid (CAS 1135-24-6) Key Players in North America
12.3 Africa Natural Ferulic Acid (CAS 1135-24-6) Market Size by Type
12.4 Africa Natural Ferulic Acid (CAS 1135-24-6) Market Size by Application
13. Oceania
13.1 Oceania Natural Ferulic Acid (CAS 1135-24-6) Market Size
13.2 Oceania Natural Ferulic Acid (CAS 1135-24-6) Key Players in North America
13.3 Oceania Natural Ferulic Acid (CAS 1135-24-6) Market Size by Type
13.4 Oceania Natural Ferulic Acid (CAS 1135-24-6) Market Size by Application
14. South America
14.1 South America Natural Ferulic Acid (CAS 1135-24-6) Market Size
14.2 South America Natural Ferulic Acid (CAS 1135-24-6) Key Players in North America
14.3 South America Natural Ferulic Acid (CAS 1135-24-6) Market Size by Type
14.4 South America Natural Ferulic Acid (CAS 1135-24-6) Market Size by Application
15. Rest of the World
15.1 Rest of the World Natural Ferulic Acid (CAS 1135-24-6) Market Size
15.2 Rest of the World Natural Ferulic Acid (CAS 1135-24-6) Key Players in North America
15.3 Rest of the World Natural Ferulic Acid (CAS 1135-24-6) Market Size by Type
15.4 Rest of the World Natural Ferulic Acid (CAS 1135-24-6) Market Size by Application
16 Natural Ferulic Acid (CAS 1135-24-6) Market Dynamics
16.1 Covid-19 Impact Market Top Trends
16.2 Covid-19 Impact Market Drivers
16.3 Covid-19 Impact Market Challenges
16.4 Porter?s Five Forces Analysis
18 Regulatory Information
17 Analyst's Viewpoints/Conclusions
18 Appendix
18.1 Research Methodology
18.1.1 Methodology/Research Approach
18.1.2 Data Source
18.2 Disclaimer
Market Segmentation Analysis
By Quality Grade
-
Ordinary Quality (Food & Industrial Grade)
-
Standard purity levels
-
Used in food fortification and general applications
-
-
High Quality (Cosmetic & Pharmaceutical Grade)
-
≥99% purity
-
Low heavy metal and impurity levels
-
Premium skincare and drug intermediate applications
-
High-quality grade commands higher margins due to strict compliance standards.
By Source
-
Rice Bran Extracted
-
Wheat Bran Extracted
-
Corn Bran Extracted
-
Synthetic-Derived (for comparison in industry benchmarking)
Rice bran remains the dominant commercial source.
By Application
-
Food & Beverages
-
Functional foods
-
Dietary supplements
-
Antioxidant fortification
-
-
Cosmetics
-
Anti-aging serums
-
Sunscreen formulations
-
Skin-brightening products
-
-
Pharmaceutical Intermediates
-
Cardiovascular and anti-inflammatory drug research
-
-
Nutraceuticals
-
Animal Feed Additives
Cosmetics represent the fastest-growing application segment globally.
By End-Use Industry
-
Personal Care & Beauty
-
Food & Beverage Manufacturing
-
Pharmaceutical Manufacturing
-
Nutraceutical Companies
Upto 24 to 48 hrs (Working Hours)
Upto 72 hrs max (Working Hours) - Weekends and Public Holidays
Single User License - Allows access to only one person to the report.
Multi User License - Allows sharing with max 5 persons within organization.
Corporate License – Can be shared across entire organization.
Online Payments with PayPal
Wire Transfer / Bank Transfer
Why Choose Us
24/7 Expert Support
At ChemReports, we understand that business decisions can’t wait. Our research specialists are available anytime to answer your queries and guide you through our reports, ensuring quick and reliable assistance.
Comprehensive Market Coverage
ChemReports provides 360° market analysis across materials, technologies, and global chemical sectors—helping you make confident business decisions.
Actionable Intelligence
We turn complex data into strategic insights to support fact-based decisions, market entry strategies, and competitive analysis.
Data Privacy & Security
Your personal and business information is completely secure with us. We value your trust and ensure strict confidentiality.
Customized Research
Need tailored insights? Our analysts provide custom reports built on authentic data and aligned with your specific business goals.